Download the full report PDF, 1.72MB
Market spotlight: Europe’s supply chain diversification
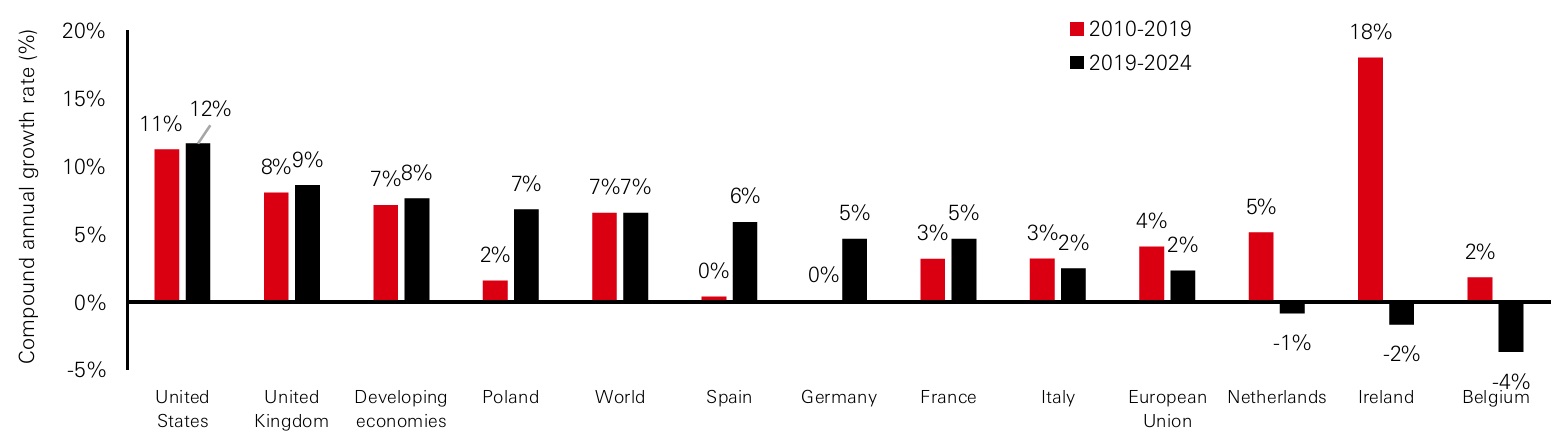
The European Union remains one of the world’s most important hubs for trade and investment. Over the past decade, European firms have steadily expanded abroad, with the US now leading destination for foreign direct investment (FDI) originating from EU-based companies. While FDI flows often reflect near-term drivers such as growth prospects, policy incentives, or cost considerations, they also serve as a forward-looking signal of firms’ strategic priorities and long-term positioning.
Figure 1: FDI instock dynamics over 2019-2024 compared to 2010-2019
Click the image to enlarge
Source: United Nations Trade and Development, HSBC AM calculations - as of 17/09/2025
The Covid-19 pandemic and the subsequent energy crisis marked a turning point. Since then, FDI inflows into the EU have halved, even as the US and several developing economies have continued to attract steady commitments. Looking beyond annual volatility, structural patterns emerge as disinvestment has been concentrated in the Netherlands, Ireland, and Belgium, where multinational headquarters and holding companies dominate the landscape. By contrast, Germany, France, Spain, and Poland have retained strong appeal, supported by high-quality infrastructure and a skilled workforce, notably in Eastern and Southern Europe.
Sectoral dynamics also reveal shifting contours.1 Manufacturing FDI has declined in the face of elevated energy costs and uncertain demand, while trade tensions have weighed on software and IT services. Yet not all sectors are retrenching. R&D investment is rising, albeit from a modest base, and services in areas such as logistics, finance, and customer engagement remain robust. According to a recent business survey2, defense-related investment is also gathering momentum, with European firms ramping up spending in response to geopolitical pressures. Notably, 60 per cent of FDI into Europe originates from within the region itself, often led by small and medium-sized enterprises expanding into neighbouring markets.
Taken together, these trends suggest a structural tilt toward domestic and nearshoring strategies. Hence, EU has introduced series of policy initiatives – spanning regulatory reform and targeted financial incentives – designed to reinforce this shift by boosting internal production capacity and diversifying supply chains in critical areas.
1 - United Nations World Investment report 2025 https://unctad.org/
2 - EY report: FDI surveys “Why Europe’s confidence persists despite investment at a nine-year low” May 2025 - https://www.ey.com/
For informational purposes only and should not be construed as a recommendation to invest in the specific country, product, strategy, sector or security. The views expressed above were held at the time of preparation and are subject to change without notice. Any forecast, projection or target where provided is indicative only and not guaranteed in any way. HSBC Asset Management accepts no liability for any failure to meet such forecast, projection or target.
European equities
Green shoots amid uneven earnings
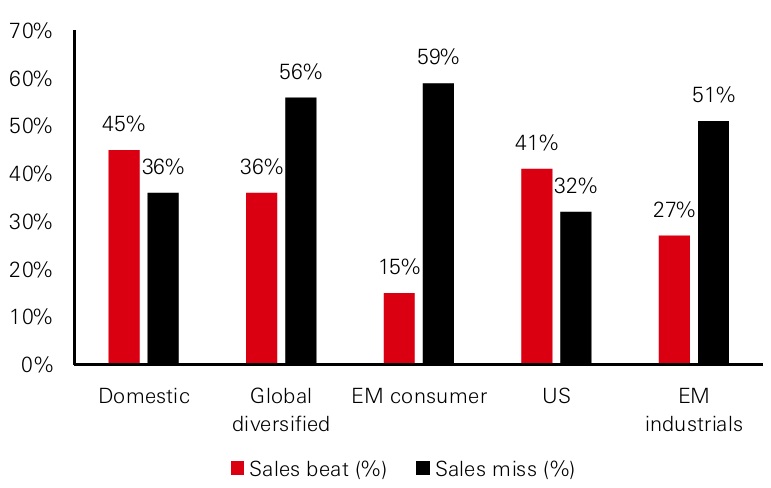
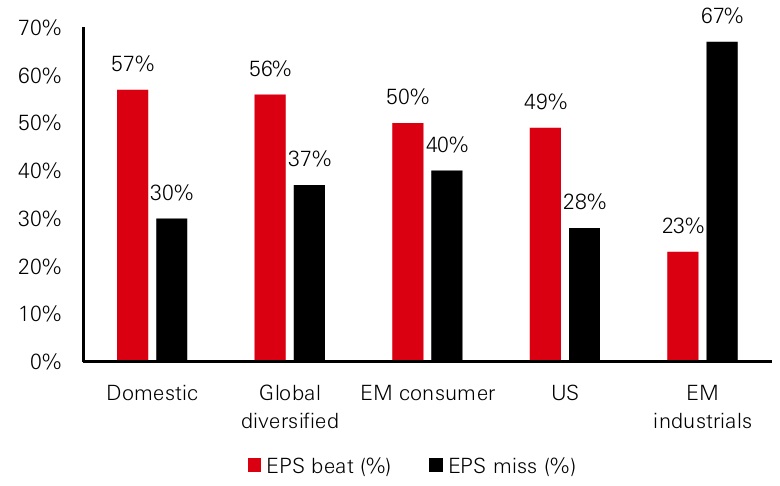
Shifts in investment flows across Europe are beginning to show up in corporate performance. Europe’s second quarter earnings season painted a mixed picture with both fragility and resilience. Broadly, headline earnings rose 4.2 per cent year-on-year, comfortably ahead of flat expectations, even as revenues slipped in line with forecasts. Beneath the surface, however, the picture was uneven. Only half of companies exceeded EPS forecasts – the weakest performance since 2016 – while just over a third managed to surpass sales expectations. Cyclicals outside of financials disappointed, reflecting manufacturing indicators that, though improving, remain in contractionary territory.
European earnings show fragile recovery with cheap valuations leaving scope for re-rating.
Figure 2: Revenue exposure of European companies
Click the image to enlarge
Click the image to enlarge
Sources: HSBC AM, Bloomberg, data as of August 2025.
Financials were the clear bright spot. Banks, in particular, continue to benefit from an advantageous rate environment, steepening yield curves, and healthier loan-to-deposit dynamics. Despite their strong run over the past year, valuations remain compelling as banks trade at a 37 per cent discount to the broader market compared with a historical average of 25 per cent. With dividends, buybacks, and earnings momentum, the sector could still deliver attractive double-digit returns. Efficiency gains from digitisation and benign credit costs add further resilience.
Elsewhere, the drag from autos and luxury goods was notable, with sales and earnings plunging by more than 40 per cent and 30 per cent, respectively. Stripping these sectors out, European sales growth would have been positive, and EPS growth would have exceeded 12 per cent, narrowing the gap with the US at 12.4 per cent. Pharmaceuticals stood out as a defensive anchor, delivering 21 per cent EPS growth despite dollar weakness, which was responsible for roughly a third of the region’s earnings slowdown.
Domestic-focused firms fared better than those exposed to emerging markets, though US exposed revenues remained resilient. Looking forward, the trajectory of European equities rests on a handful of pivotal factors like stabilisation in luxury and autos, continued strength in financials, steadier currency dynamics, and demand trends across the US and EM. Despite the recent rally, valuations in European equity markets remain low, presenting selective value opportunities.
The views expressed above were held at the time of preparation and are subject to change without notice. Any forecast, projection or target where provided is indicative only and not guaranteed in any way. HSBC Asset Management accepts no liability for any failure to meet such forecast, projection or target.
European fixed income
Relative resilience in credit markets
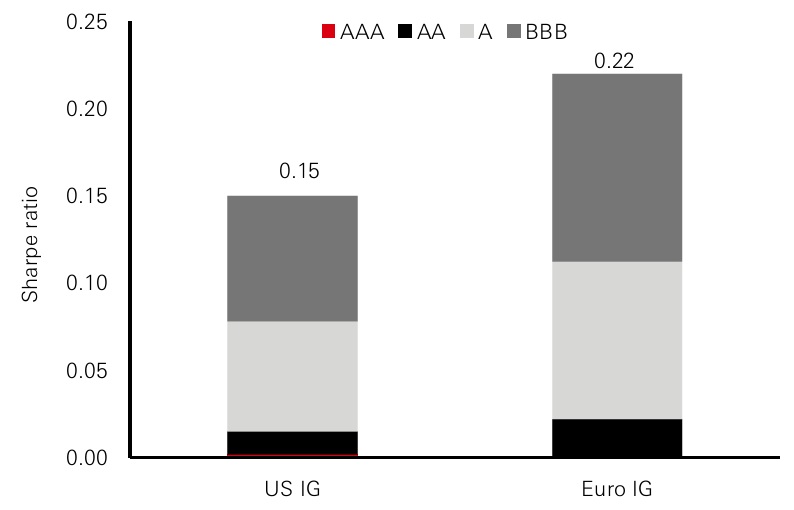
While equities debate recovery, Europe’s fixed income markets have been quietly delivering. Over the past decade, Europe’s credit markets have outperformed the US, particularly in high yield. Duration-adjusted performance shows higher Sharpe ratios in European credit, with high yield issuers weathering multiple shocks better than peers across the Atlantic. Even during the defaults of Russian issuers which drove sharp moves, European credit exhibited relative resilience, a testament to more conservative financial policies.
The reasons lie less in growth – Europe’s has been sluggish – and more in discipline. European issuers, scarred by years of low expansion, have kept leverage conservative. Inflation, though painful for consumers, has eroded the real value of debt, further supporting credit dynamics. The combination of modest growth, cautious corporate behaviour, and inflation’s debt-eroding effect has created an environment where defaults have been contained and returns more stable.
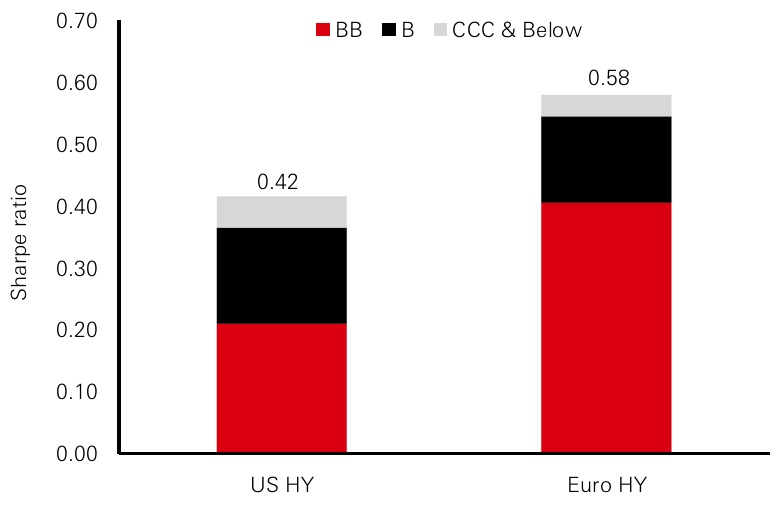
Europe’s stronger credit mix has supported superior sharpe ratios versus the US over the last decade.
Figure 3: Rating groups’ contribution to IG sharpe ratio for period 31/12/2014 to 31/07/2025
Click the image to enlarge
Figure 4: Rating groups’ contribution to HY sharpe ratio for period 31/12/2014 to 31/07/2025
Click the image to enlarge
Past performance does not predict future returns.
Total returns hedged in USD for the US and EUR. Returns are duration adjusted as US indices have significant higher durations. The calculation is made with constant duration indices, duration =5.
Sources: ICE indices, HSBC AM, data as of July 2025. Based on the ICE BofA US corporate index (C0A0,) ICE Bofa Euro corporate index (ER00), ICE BofA US High Yield index (H0A0), ICE BofA Euro High Yield index (HE00).
Credit quality differences further bolster Europe’s relative strength, particularly in its high yield universe, which has a higher share of BB-rated names – historically the best risk-adjusted performers – while the US carries a heavier weighting of CCC-rated bonds, the weakest cohort.
These structural differences also explain why, despite Europe’s subdued growth backdrop, its credit markets have delivered robust performance. Europe has rewarded not through rapid expansion but through lower volatility and stronger fundamentals at the issuer level.
Looking ahead, the resilience of European growth – low but avoiding recession – alongside cautious corporate financial policies should continue to underpin the appeal of Euro credit. For global investors seeking diversification, and favourable risk-adjusted returns, Europe’s fixed income markets remain a compelling counterpart to US credit.
The views expressed above were held at the time of preparation and are subject to change without notice. Any forecast, projection or target where provided is indicative only and not guaranteed in any way. HSBC Asset Management accepts no liability for any failure to meet such forecast, projection or target.
For Professional Clients and intermediaries within countries and territories set out below; and for Institutional Investors and Financial Advisors in the US. This document should not be distributed to or relied upon by Retail clients/investors.
The value of investments and the income from them can go down as well as up and investors may not get back the amount originally invested. The performance figures contained in this document relate to past performance, which should not be seen as an indication of future returns. Future returns will depend, inter alia, on market conditions, investment manager’s skill, risk level and fees. Where overseas investments are held the rate of currency exchange may cause the value of such investments to go down as well as up. Investments in emerging markets are by their nature higher risk and potentially more volatile than those inherent in some established markets. Economies in Emerging Markets generally are heavily dependent upon international trade and, accordingly, have been and may continue to be affected adversely by trade barriers, exchange controls, managed adjustments in relative currency values and other protectionist measures imposed or negotiated by the countries and territories with which they trade. These economies also have been and may continue to be affected adversely by economic conditions in the countries and territories in which they trade.
The contents of this document may not be reproduced or further distributed to any person or entity, whether in whole or in part, for any purpose. All non-authorised reproduction or use of this document will be the responsibility of the user and may lead to legal proceedings. The material contained in this document is for general information purposes only and does not constitute advice or a recommendation to buy or sell investments. Some of the statements contained in this document may be considered forward looking statements which provide current expectations or forecasts of future events. Such forward looking statements are not guarantees of future performance or events and involve risks and uncertainties. Actual results may differ materially from those described in such forward-looking statements as a result of various factors. We do not undertake any obligation to update the forward-looking statements contained herein, or to update the reasons why actual results could differ from those projected in the forward-looking statements. This document has no contractual value and is not by any means intended as a solicitation, nor a recommendation for the purchase or sale of any financial instrument in any jurisdiction in which such an offer is not lawful. The views and opinions expressed herein are those of HSBC Asset Management at the time of preparation, and are subject to change at any time. These views may not necessarily indicate current portfolios' composition. Individual portfolios managed by HSBC Asset Management primarily reflect individual clients' objectives, risk preferences, time horizon, and market liquidity. Foreign and emerging markets. Investments in foreign markets involve risks such as currency rate fluctuations, potential differences in accounting and taxation policies, as well as possible political, economic, and market risks. These risks are heightened for investments in emerging markets which are also subject to greater illiquidity and volatility than developed foreign markets. This commentary is for information purposes only. It is a marketing communication and does not constitute investment advice or a recommendation to any reader of this content to buy or sell investments nor should it be regarded as investment research. It has not been prepared in accordance with legal requirements designed to promote the independence of investment research and is not subject to any prohibition on dealing ahead of its dissemination. This document is not contractually binding nor are we required to provide this to you by any legislative provision.
All data from HSBC Asset Management unless otherwise specified. Any third party information has been obtained from sources we believe to be reliable, but which we have not independently verified.
HSBC Asset Management is the brand name for the asset management business of HSBC Group, which includes the investment activities that may be provided through our local regulated entities. HSBC Asset Management is a group of companies in many countries and territories throughout the world that are engaged in investment advisory and fund management activities, which are ultimately owned by HSBC Holdings Plc. (HSBC Group). The above communication is distributed by the following entities:
- In Australia, this document is issued by HSBC Bank Australia Limited ABN 48 006 434 162, AFSL 232595, for HSBC Global Asset Management (Hong Kong) Limited ARBN 132 834 149 and HSBC Global Asset Management (UK) Limited ARBN 633 929 718. This document is for institutional investors only, and is not available for distribution to retail clients (as defined under the Corporations Act). HSBC Global Asset Management (Hong Kong) Limited and HSBC Global Asset Management (UK) Limited are exempt from the requirement to hold an Australian financial services license under the Corporations Act in respect of the financial services they provide. HSBC Global Asset Management (Hong Kong) Limited is regulated by the Securities and Futures Commission of Hong Kong under the Hong Kong laws, which differ from Australian laws. HSBC Global Asset Management (UK) Limited is regulated by the Financial Conduct Authority of the United Kingdom and, for the avoidance of doubt, includes the Financial Services Authority of the United Kingdom as it was previously known before 1 April 2013, under the laws of the United Kingdom, which differ from Australian laws;
- in Bermuda by HSBC Global Asset Management (Bermuda) Limited, of 37 Front Street, Hamilton, Bermuda which is licensed to conduct investment business by the Bermuda Monetary Authority;
- in Chile: Operations by HSBC's headquarters or other offices of this bank located abroad are not subject to Chilean inspections or regulations and are not covered by warranty of the Chilean state. Obtain information about the state guarantee to deposits at your bank or on www.cmfchile.cl;
- in Colombia: HSBC Bank USA NA has an authorized representative by the Superintendencia Financiera de Colombia (SFC) whereby its activities conform to the General Legal Financial System. SFC has not reviewed the information provided to the investor. This document is for the exclusive use of institutional investors in Colombia and is not for public distribution;
- in France, Belgium, Netherlands, Luxembourg, Portugal, Greece, Finland, Norway, Denmark and Sweden by HSBC Global Asset Management (France), a Portfolio Management Company authorised by the French regulatory authority AMF (no. GP99026);
- in Germany by HSBC Global Asset Management (Deutschland) GmbH which is regulated by BaFin (German clients) respective by the Austrian Financial Market Supervision FMA (Austrian clients);
- in Hong Kong by HSBC Global Asset Management (Hong Kong) Limited, which is regulated by the Securities and Futures Commission. This video/content has not be reviewed by the Securities and Futures Commission;
- in India by HSBC Asset Management (India) Pvt Ltd. which is regulated by the Securities and Exchange Board of India;
- in Italy and Spain by HSBC Global Asset Management (France), a Portfolio Management Company authorised by the French regulatory authority AMF (no. GP99026) and through the Italian and Spanish branches of HSBC Global Asset Management (France), regulated respectively by Banca d’Italia and Commissione Nazionale per le Società e la Borsa (Consob) in Italy, and the Comisión Nacional del Mercado de Valores (CNMV) in Spain;
- in Malta by HSBC Global Asset Management (Malta) Limited which is regulated and licensed to conduct Investment Services by the Malta Financial Services Authority under the Investment Services Act;
- in Mexico by HSBC Global Asset Management (Mexico), SA de CV, Sociedad Operadora de Fondos de Inversión, Grupo Financiero HSBC which is regulated by Comisión Nacional Bancaria y de Valores;
- in the United Arab Emirates, Qatar, Bahrain & Kuwait by HSBC Global Asset Management MENA, a unit within HSBC Bank Middle East Limited, U.A.E Branch, PO Box 66 Dubai, UAE, regulated by the Central Bank of the U.A.E. and the Securities and Commodities Authority in the UAE under SCA license number 602004 for the purpose of this promotion and lead regulated by the Dubai Financial Services Authority. HSBC Bank Middle East Limited is a member of the HSBC Group and HSBC Global Asset Management MENA are marketing the relevant product only in a sub-distributing capacity on a principal-to-principal basis. HSBC Global Asset Management MENA may not be licensed under the laws of the recipient’s country of residence and therefore may not be subject to supervision of the local regulator in the recipient’s country of residence. One of more of the products and services of the manufacturer may not have been approved by or registered with the local regulator and the assets may be booked outside of the recipient’s country of residence.
- in Peru: HSBC Bank USA NA has an authorized representative by the Superintendencia de Banca y Seguros in Perú whereby its activities conform to the General Legal Financial System - Law No. 26702. Funds have not been registered before the Superintendencia del Mercado de Valores (SMV) and are being placed by means of a private offer. SMV has not reviewed the information provided to the investor. This document is for the exclusive use of institutional investors in Perú and is not for public distribution;
- in Singapore by HSBC Global Asset Management (Singapore) Limited, which is regulated by the Monetary Authority of Singapore. The content in the document/video has not been reviewed by the Monetary Authority of Singapore;
- In Switzerland by HSBC Global Asset Management (Switzerland) AG. This document is intended for professional investor use only. For opting in and opting out according to FinSA, please refer to our website; if you wish to change your client categorization, please inform us. HSBC Global Asset Management (Switzerland) AG having its registered office at Gartenstrasse 26, PO Box, CH-8002 Zurich has a licence as an asset manager of collective investment schemes and as a representative of foreign collective investment schemes. Disputes regarding legal claims between the Client and HSBC Global Asset Management (Switzerland) AG can be settled by an ombudsman in mediation proceedings. HSBC Global Asset Management (Switzerland) AG is affiliated to the ombudsman FINOS having its registered address at Talstrasse 20, 8001 Zurich. There are general risks associated with financial instruments, please refer to the Swiss Banking Association (“SBA”) Brochure “Risks Involved in Trading in Financial Instruments;
- in Taiwan by HSBC Global Asset Management (Taiwan) Limited which is regulated by the Financial Supervisory Commission R.O.C. (Taiwan);
- in Turkiye by HSBC Asset Management A.S. Turkiye (AMTU) which is regulated by Capital Markets Board of Turkiye. Any information here is not intended to distribute in any jurisdiction where AMTU does not have a right to. Any views here should not be perceived as investment advice, product/service offer and/or promise of income. Information given here might not be suitable for all investors and investors should be giving their own independent decisions. The investment information, comments and advice given herein are not part of investment advice activity. Investment advice services are provided by authorized institutions to persons and entities privately by considering their risk and return preferences, whereas the comments and advice included herein are of a general nature. Therefore, they may not fit your financial situation and risk and return preferences. For this reason, making an investment decision only by relying on the information given herein may not give rise to results that fit your expectations.
- in the UK by HSBC Global Asset Management (UK) Limited, which is authorised and regulated by the Financial Conduct Authority;
- and in the US by HSBC Global Asset Management (USA) Inc. which is an investment adviser registered with the US Securities and Exchange Commission.
- In Uruguay, operations by HSBC's headquarters or other offices of this bank located abroad are not subject to Uruguayan inspections or regulations and are not covered by warranty of the Uruguayan state. Further information may be obtained about the state guarantee to deposits at your bank or on www.bcu.gub.uy.
Copyright © HSBC Global Asset Management Limited 2025. All rights reserved. No part of this publication may be reproduced, stored in a retrieval system, or transmitted, on any form or by any means, electronic, mechanical, photocopying, recording, or otherwise, without the prior written permission of HSBC Global Asset Management Limited.
Content ID: D056687_v4.0; Expiry date: 30.09.2026.
