
Equity Insights
In a nutshell
- Profits remain an important market anchor, but recent volatility in AI and semiconductor stocks shows that markets are increasingly differentiating between companies that can translate capital expenditure into durable revenue and free cash flow and those that remain more dependent on expectations
- AI leadership is expanding beyond hyperscalers and leading chipmakers into the ecosystem around them, although a relatively narrow group of companies still accounts for a large share of earnings upgrades
- Strong earnings growth has lowered reported price-to-earnings multiples, but cash based and balance sheet valuation measures remain elevated, arguing for participation in the AI cycle without taking an indiscriminate “all-in” position
- The oil shock is creating clear regional and sector fault lines. US earnings appear relatively resilient, while Europe and parts of Asia are more exposed and the outcomes are more nuanced
- Emerging markets are becoming a more important source of global profit growth. Diversified exposure to technology, commodities and selected industries is supporting earnings, while stronger domestic investor bases have helped offset foreign outflows
- Structural under ownership, lower relative valuations and a widening global capex cycle support opportunities outside the narrowest US leaders. Investors should continue to focus on markets and companies where earnings delivery, real demand, competitive advantage and structural change reinforce one another
For informational purposes only and should not be construed as a recommendation to invest in the specific country, product, strategy, sector or security. The views expressed above were held at the time of preparation and are subject to change without notice. Any forecast, projection or target where provided is indicative only and not guaranteed in any way. HSBC Asset Management accepts no liability for any failure to meet such forecast, projection or target. Source: HSBC Asset Management, July 2026.
The next phase of broadening
The equity opportunity is widening, but investors are increasingly asking where capital spending is translating into durable earnings and cash flow.
The closure of the Strait of Hormuz and renewed volatility in oil prices have complicated the outlook for inflation and interest rates. For much of the first half, equities remained resilient because earnings, rather than liquidity, were the primary anchor for valuations. More recently, however, volatility in AI and semiconductor stocks has shown that this support is conditional. Investors are distinguishing more aggressively between companies delivering cash returns and those still dependent on continued capex optimism.
That shift is not a rejection of the AI theme. Demand for compute, memory and related infrastructure remains strong, but the market is reassessing how much of the expected value has already been priced in. The distinction between lumpy, capex driven infrastructure revenues and potentially more recurring adoption revenues has therefore become more important, particularly for hardware and memory companies whose earnings depend heavily on the next round of spending.
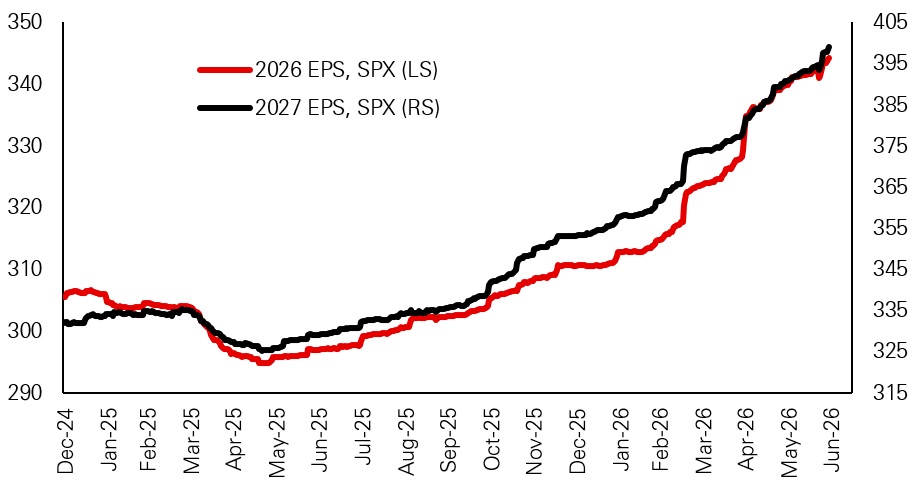
While the market is judging AI stocks more closely, consensus earnings expectations for both this year and next have continued to rise. This is unusual, because analysts typically begin the year with optimistic forecasts and gradually revise them lower. The upward revisions do not mean investors are looking through next year’s earnings; rather, they raise the hurdle. Markets are asking whether future profits can grow quickly enough, and convert into cash reliably enough, to justify the capital intensity and valuations attached to the theme.
Figure 1: S&P 500 consensus earnings expectations for 2026 and 2027
Click the image to enlarge
Past performance does not predict future returns.
Source: HSBC AM, Bloomberg. Data as of July 2026.
For informational purposes only and should not be construed as a recommendation to invest in the specific country, product, strategy, sector or security. The views expressed above were held at the time of preparation and are subject to change without notice. Any forecast, projection or target where provided is indicative only and not guaranteed in any way. HSBC Asset Management accepts no liability for any failure to meet such forecast, projection or target. Index returns assume reinvestment of all distributions and do not reflect fees or expenses. You cannot invest directly in an index. Source: HSBC Asset Management, July 2026.
Beneath the headline upgrades, leadership is narrow. Sectors with clear pricing power, robust demand visibility and direct or second order exposure to the AI investment cycle have done most of the heavy lifting, supported by improved energy profitability as oil prices have risen. In fact, the top ten contributors in the S&P 500 account for more than half of recent earnings upgrades, underscoring how concentrated the profit engine remains.
This earnings strength helps to explain why the usual macro driven playbook struggled. In a more traditional risk off environment, a geopolitical shock, higher oil prices and a repricing of interest rate expectations would normally put broad pressure on equities. Instead, valuations that appear stretched on simple price to earnings metrics look more reasonable once one recognises that the earnings base is being revised higher. Moreover, earnings surprises have had a greater influence on market moves than broader macro surprises.
Yet recent volatility is a reminder that strong profits do not remove valuation or positioning risk. The market is increasingly differentiating between companies with recurring adoption revenues and those whose earnings are more directly tied to the next round of capital spending.
The narrow AI cycle
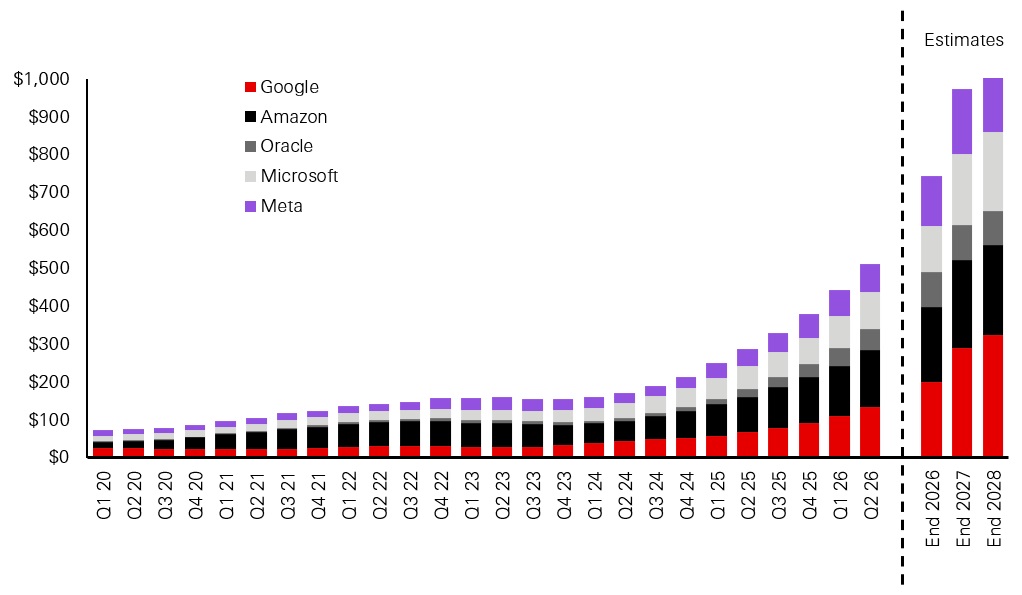
The AI investment cycle remains the central pillar of the current equity narrative. Hyperscalers have repeatedly upgraded capital expenditure plans, forcing analysts to revise up both the magnitude and duration of the cycle and prompting comparisons with previous ‘mega cycles’ in technology and infrastructure. The question now is not only how long the cycle lasts, but whether each additional unit of spending earns an adequate return.
Data centre revenues now account for around 90 per cent of growth at leading AI chip manufacturers, and US hyperscaler capex is expected to exceed USD1 tn by 2027, underscoring how dependent current earnings momentum is on this investment continuing to run at pace.
Figure 2: Rolling 12m trailing capex to end of quarter for Hyperscalers (USD bn)
Click the image to enlarge
Source: HSBC AM, Factset. Data as of July 2026.
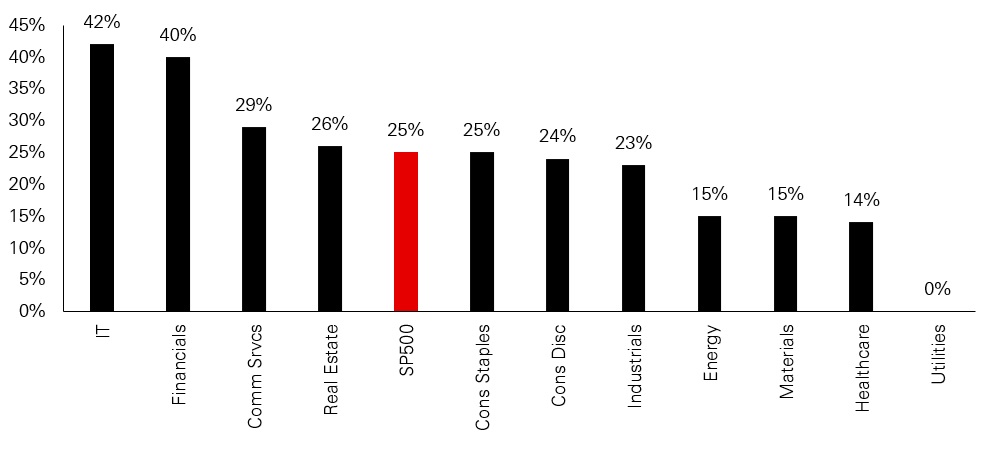
The AI story is no longer only about expectations. It has spread beyond the companies directly involved in building the technology. In 2023, only around 4 per cent of S&P 500 companies discussed quantifiable benefits from AI on their earnings calls. That figure is now closer to 25 per cent, signalling both faster adoption and considerable remaining headroom. Companies are moving from experimentation to budget allocation, from concept to implementation, and in some cases from implementation to measurable productivity, revenue or margin impact.
Figure 3: per cent of companies within S&P sectors mentioning quantifiable AI related impacts
Click the image to enlarge
Source: Morgan Stanley, HSBC AM, May 2026.
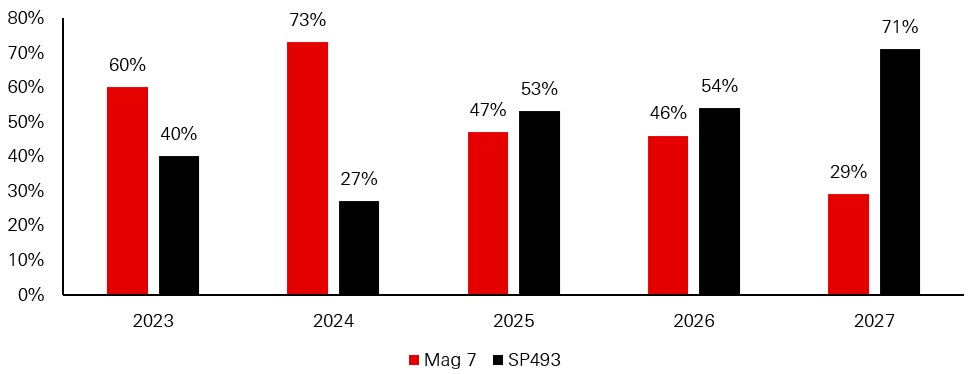
Even so, the distinction between adoption and earnings contribution is critical. AI infrastructure and adjacent semiconductor companies still account for a disproportionate share of S&P 500 profit growth. While the contribution from the Magnificent 7 has declined relative to recent years, leadership is better described as a widening within the AI ecosystem than a fully diversified equity market.
Figure 4: Net income growth (per cent)
Click the image to enlarge
Source: Company data, Morgan Stanley Research estimates, May 2026
This distinction highlights that the market is not simply moving from a small group of mega cap technology companies to the whole equity market. It is moving from the most obvious AI winners into a wider group of enablers, beneficiaries and second order exposures. These include semiconductors, memory, data centres, power, cooling, infrastructure, industrial equipment and parts of the capital goods complex.
To assess the next phase, it is useful to separate capex-based revenues from adoption revenues. The former are lumpy and depend on continued infrastructure budgets; the latter are potentially more recurring and provide better evidence that AI is improving productivity, revenue or margins across end users.
Recent volatility has brought this distinction into sharper focus. Concerns about hyperscaler funding, potential excess compute capacity, lower cost and open source models, slowing memory price gains and intensifying Chinese competition all raise questions about where pricing power and returns will persist.
The risk is therefore not that AI has stopped mattering. It is that the path from build out to monetisation will be uneven, with pauses, setbacks and larger gaps between the eventual winners and losers.
Valuation tension
Recent volatility shows how quickly support for some AI stocks can strengthen or weaken as investors reassess the return on spending, the durability of monetisation and the availability of financing, as hyperscalers encounter funding and concentration limits.
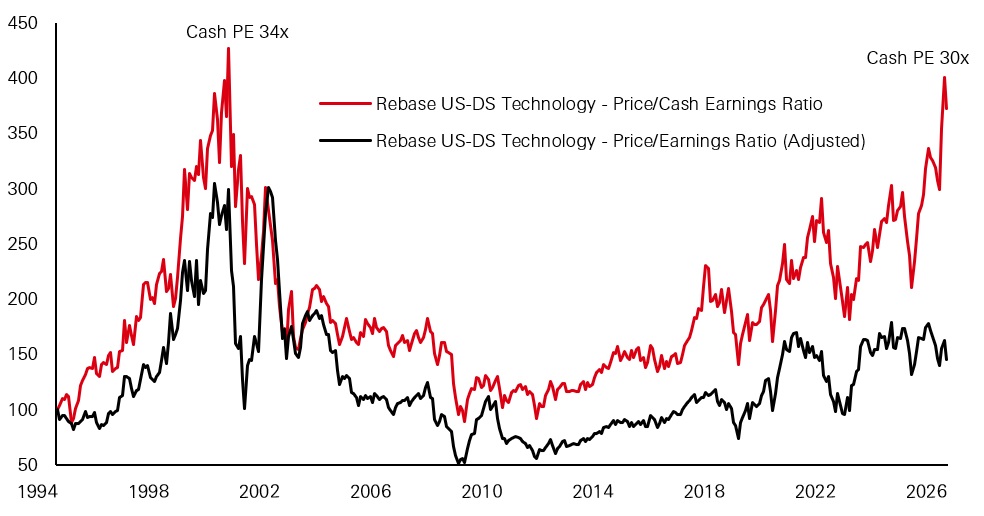
Valuation signals in US technology capture this dynamic. Reported price to earnings multiples have compressed as earnings have surged, but price to cash earnings and price to book ratios have moved higher and now sit near early 2000s levels. On simple price to earnings measures, parts of the market can look less stretched because the earnings denominator has grown so quickly. On cash based and balance sheet measures, valuations look more demanding.
Figure 5: Relative move in cash versus reported price-to-earnings (x)
Click the image to enlarge
Source: HSBC AM, Refinitiv. Data as of July 2026.
The result is a cycle supported by real revenues, real capex and real earnings upgrades, but one that still does not argue for an unqualified ‘all in’ stance. Strong reported EPS is less reassuring when cash earnings lag, particularly if the assets being built become obsolete faster than assumed. Equally, staying ‘all out’ risks missing one of the most important technology and investment cycles in decades.
The more balanced view is that AI-linked equities still deserve a central place in equity portfolios, but the bar for incremental upside is rising. Investors need to distinguish between companies already generating earnings, those where monetisation remains largely speculative, and those whose valuations leave little room for disappointment. However, the balance becomes harder to strike as the oil shock introduces a second test for earnings.
Oil shock fault lines
The recent oil price volatility following the closure of the Strait of Hormuz has added another layer of complexity. Thus far, markets have largely treated the disruption as manageable. Energy earnings have been upgraded, and there is little evidence at the index level of a broad downgrade cycle.
However, the aggregate picture hides important dispersion. Equal-weighted US consumer discretionary earnings expectations have already been revised lower as higher energy prices and inflation weigh on household sensitive segments. The sector – dominated by Tesla and Amazon – appears more resilient, but that resilience masks weakness in the broader consumer facing universe.
The market’s reaction to oil has therefore been more surgical than broad based. Some stocks and sectors are already responding to higher costs and weaker consumer demand, but the aggregate index is still being driven by secular AI trends and strong earnings surprises.
The risk is that earnings forecasts still do not fully capture a longer disruption. Oil is notoriously difficult to forecast, and analysts are increasingly relying on scenarios rather than point estimates. Reopening assumptions have already been pushed back, with more pessimistic scenarios being introduced, but these have not yet filtered meaningfully into aggregate earnings forecasts or broad market performance.
Using a top-down earnings model for the US, with PMIs, CPI, PPI and the dollar as inputs, a less disruptive scenario in which energy supply conditions gradually normalise points to a moderation in earnings growth after a very strong first half, but not a collapse. Under a more prolonged disruption assuming a resolution timeframe of around six months, sustained pressure on producer and consumer prices, weaker manufacturing activity and a stronger dollar would slow earnings more meaningfully. Even then, the model suggests that earnings growth would likely slow or flatten into year end rather than collapse outright.
That resilience reflects the unusual composition of US earnings. The US has large technology and AI-linked sectors, strong pricing power in parts of the market, and enough earnings momentum to absorb some macro pressure. A prolonged energy shock would still matter, but it may not be enough on its own to overturn the broader US profit cycle, unless it also disrupts AI capex or forces a sharper tightening in financial conditions.
Europe, by contrast, faces a more challenging equation. The region has seen modest earnings upgrades of roughly 2 per cent-3 per cent in recent months, supported in part by energy, but lacks the same scale of AI linked earnings support as the US. It is also structurally more exposed to higher input costs and weaker activity. Top-down models indicate that in a downside scenario characterised by a persistent PPI-CPI wedge and weaker PMIs, European earnings could come under meaningful pressure as early as the third quarter, reflecting their higher sensitivity to supply side shocks. Valuations remain supportive and selected companies retain strong cashflow characteristics, but the regional earnings story is more fragile and requires greater selectivity.
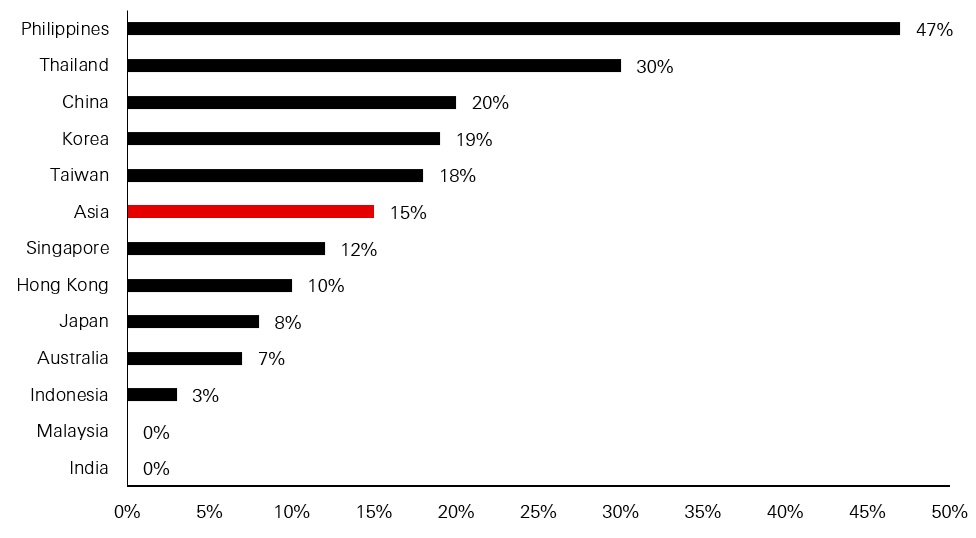
Across Asia, the impact of higher oil prices is being mediated by policy choices. While benchmark crude prices are up roughly 50–60 per cent, retail fuel prices have risen by closer to 15 per cent on average. Countries such as India have absorbed more of the increase fiscally, while others, including the Philippines and Thailand, have passed through a larger share to consumers. The implications for inflation, real incomes and corporate earnings are therefore highly country specific.
Figure 6: Domestic gasoline price rise since February 2026 (per cent)
Click the image to enlarge
Source: CEIC, GlobalPetrolPrices.com, Morgan Stanley Research, May 2026.
The oil shock, therefore, makes the playbook narrower. Energy importers, consumer facing sectors and regions with weak pass-through mechanisms need to be treated differently from markets with commodity exposure, AI-linked exports or stronger domestic demand buffers. These regional fault lines bring the broadening opportunity in emerging markets into sharper focus.
EM profit broadening
Against this backdrop, the most compelling ‘broadening out’ story is still in emerging markets, which have continued the strong outperformance seen last year. Even here, however, the picture is not entirely straightforward. Year to date performance has been concentrated in Korea and Taiwan and heavily driven by the technology sector, much like the narrow leadership seen in developed markets. In Korea, the surge in domestic retail participation and the use of leveraged ETFs have added another layer of volatility. This raises an important question of whether emerging markets can continue to outperform if market leadership broadens beyond AI.
There are good reasons to think they can. The first is valuation. Despite rising by around 13 per cent year to date, EM equities have become approximately 30 per cent cheaper on a forward price to earnings basis since the start of the year, as earnings upgrades have outpaced share price gains. This suggests that markets remain sceptical about the durability of the EM earnings recovery.
Even allowing for the possibility that forward earnings expectations prove too optimistic, there is still a meaningful valuation buffer. On trailing earnings, EM equities trade at a discount of more than 30 per cent to developed markets, close to the widest level in a decade. Valuation alone is not an investment case, but it provides a more supportive starting point where company fundamentals and earnings delivery continue to improve.
The second reason is that the EM earnings opportunity extends well beyond AI. Emerging markets sit at the intersection of several powerful structural megatrends. They supply many of the critical materials needed for the global energy transition, benefit from rising credit penetration and financial inclusion, and contain companies that are moving further up the global value chains.
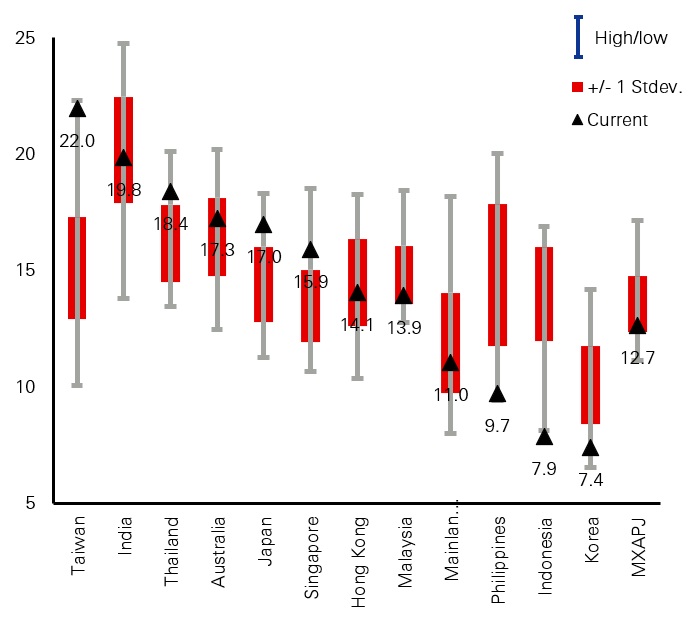
Figure 7: 12M forward P/E Asian equity valuations (x)
Click the image to enlarge
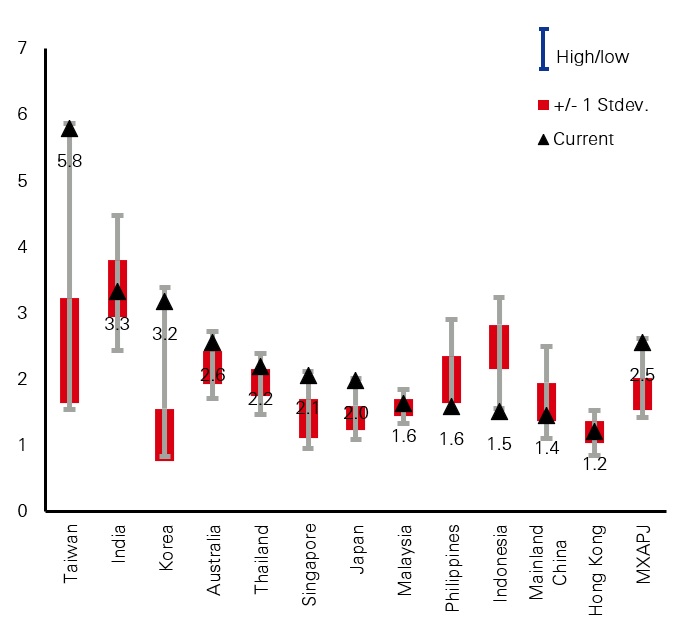
Figure 8: 12M trailing P/B Asian equity valuations (x)
Click the image to enlarge
Past performance does not predict future returns.
Source: HSBC AM, Goldman Sachs, MSCI. Data as of June 2026.
Innovation is also broader than the semiconductor cycle. Emerging market companies are building leading positions in biotechnology, new energy, fintech, robotics and other advanced industries. These businesses offer different sources of growth from AI hardware and memory, with earnings increasingly linked to domestic adoption, market share gains and company specific execution.
Encouragingly, market performance has begun to broaden since June, both across countries and sectors. EM markets are therefore not rising or falling together, and the region increasingly reflects a more differentiated mix of earnings drivers, positioning and market structure. The near term earnings story, however, is only one part of the EM case.
EM in the global innovation and IPO cycle
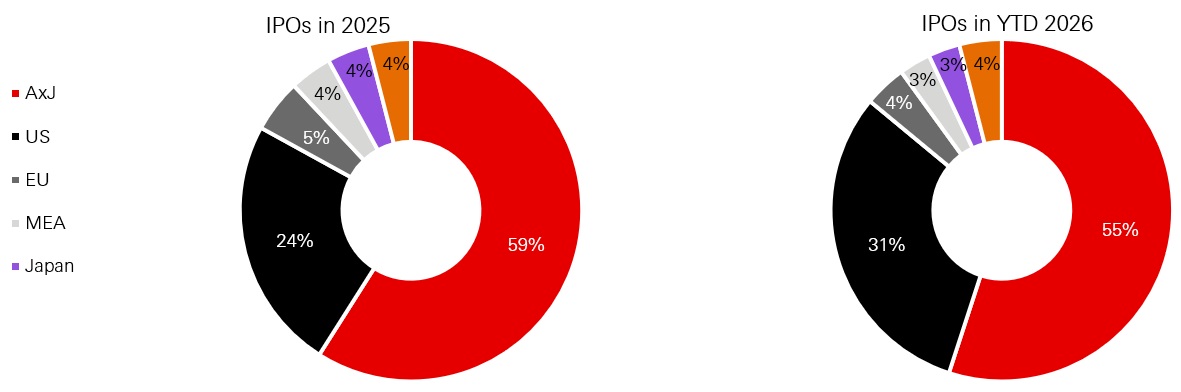
The second part of the EM story is structural as the region is also changing the composition of its equity markets. Globally, 2026 is shaping up to be one of the largest IPO fundraising years on record, led by high profile US listings such as OpenAI, Anthropic and SpaceX, which could command a valuation in excess of USD1.5 tn. Whether in the US, China or other EM regions, the underlying theme is similar – fast growing, technology and innovation driven businesses are tapping public markets to fund scale. Global investors, meanwhile, are keen not to miss out on these growth opportunities.
Figure 9: Global IPOs breakdown for 2025 and YTD 2026 (per cent)
Click the image to enlarge
Source: HSBC AM, Refinitiv, Datastream. Data as of June 2026.
China, for instance, has already raised more IPO capital than any other region in the first quarter, with AI related companies alone raising around USD22 bn, roughly double the amount raised by US AI IPOs so far this year. Hong Kong has a record pipeline of about 500 prospective listings, many tied to AI, semiconductors, robotics and medtech. Europe’s largest IPO this year has also come from an EM issuer, and multiple fintech unicorn IPOs are expected in Africa and Latin America.
These issuances are reshaping EM indices and the nature of their earnings. Historically, EM benchmarks were dominated by commodities, state owned banks and industrial cyclicals. Today, innovative businesses spanning internet and software, semiconductors and technology hardware, pharmaceuticals, new energy, electric vehicles, fintech, media and defence account for nearly 40 per cent of EM indices, up from around 10 per cent a decade ago to. Earnings are becoming less dependent on traditional commodity cycles and external demand, and more anchored in domestic consumption, technology adoption, healthcare provision and financial inclusion.
The shift in composition has three important implications. First, it changes the quality of EM earnings. Businesses built around intellectual property, platforms and networks tend to have different margin profiles, capital intensity and growth trajectories from traditional cyclicals. The more these companies enter and grow within EM benchmarks, the less EM earnings behave like a simple commodity or global trade cycle.
Second, it changes the role of EM in global portfolios. If EM indices become more innovation heavy, they may still be volatile, but the sources of volatility and return will change. EM may become less about external demand alone and more about domestic consumption, technology platforms, healthcare, financial inclusion and the localisation of innovation.
Third, it creates a stronger role for active management. It takes time for new IPOs to enter indices. Active managers can access these companies earlier, but they also need to be selective because IPO cycles can create both genuine structural winners and overhyped listings. For example, the dispersion between innovative China listings and the broader MSCI China index shows how much difference stock selection can make.
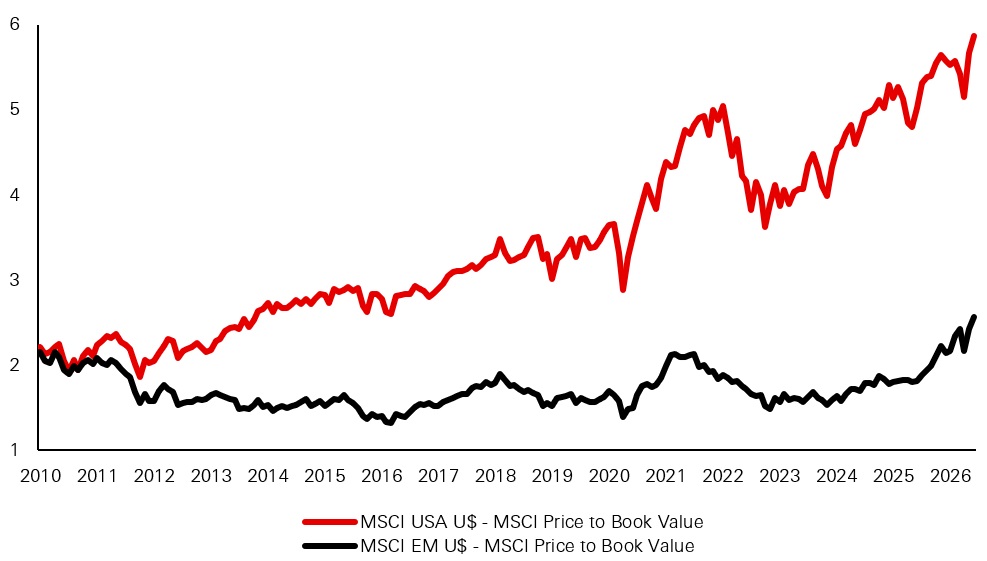
Yet valuations do not fully reflect this shift. On a forward price to earnings basis, EM still trades at roughly a 40 per cent discount to the S&P 500, close to decade low relative valuations. On price to book metrics, non-US markets, and EM in particular, remain at about one third of US levels.
It suggests that the market is not fully valuing the transformation in EM index composition or the possibility that EM earnings are becoming more durable than in previous cycles. It does not mean that EM should re-rate automatically, since governance, liquidity, policy risk and execution still matter. But the combination of changing fundamentals and wide valuation discounts strengthens the case for selective exposure.
Structural under ownership and selective broadening
Taken together, these developments point to a profit-led but bumpier and selective broadening equity cycle. AI remains at its core while an increasingly global set of beneficiaries is emerging around it. However, earnings delivery and cash returns will determine which parts of that ecosystem retain market support.
Yet allocations remain heavily skewed. Since 2020, about USD1.7 tn has flowed into US equities versus roughly USD350 bn into emerging markets, leaving non‑US and EM assets structurally under‑owned. Capex broadening can still form the bridge between AI and the rest of the market, but the opportunity extends beyond chips and cloud into power, grids, data centres, cooling systems, property, industrial equipment, copper, aluminium, memory, precision engineering and energy security.
Materials, energy, industrials and utilities can therefore participate in the physical build out, while more balanced markets such as China and India offer diversification from the concentrated hardware trade.
This does not imply a simple rotation from the US to the rest of the world, nor does it mean that every cheap market is attractive. The opportunity is more specific. It lies where earnings are being revised higher, where capex creates real demand, where valuations are not already discounting perfection, and where structural change is improving the quality of the profit base.Relative valuations reinforce the diversification case, although they need to be interpreted carefully. The price to book gap between the US and the rest of the world, especially emerging markets, has widened to an unusual level. Higher US returns on equity explain part of the premium, but the gap appears wider than differences in profitability alone would suggest. The opportunity therefore lies in identifying individual companies and markets where valuations are supported by sustainable earnings, strong balance sheets and credible returns on invested capital — not in assuming that cheaper markets will automatically re-rate.
Figure 10: Price to book comparison of US versus emerging markets (x)
Click the image to enlarge
Source: HSBC AM, Refinitiv, Datastream. Data as of June 2026.
Overall, the US remains central to the earnings cycle but carries more valuation and concentration risk, while non‑US and EM markets are cheaper and under‑owned, but still require earnings confirmation to close the gap. The sustainability of this broader opportunity set will depend on whether AI capex produces recurring adoption revenues, whether second order beneficiaries convert physical demand into cash flow, and whether EM innovation and commodity linked profits remain resilient. The next phase is therefore less about choosing between the US and the rest of the world, and more about identifying where the profit cycle is still improving and where capital spending is earning an adequate return.
Past performance does not predict future returns. The level of yield is not guaranteed and may rise or fall in the future. For informational purposes only and should not be construed as a recommendation to invest in the specific country, product, strategy, sector or security. The views expressed above were held at the time of preparation and are subject to change without notice. Any forecast, projection or target where provided is indicative only and not guaranteed in any way. HSBC Asset Management accepts no liability for any failure to meet such forecast, projection or target. Source: HSBC Asset Management, July 2026.
Important information
For Professional Clients and intermediaries within countries and territories set out below; and for Institutional Investors and Financial Advisors in the US. This document should not be distributed to or relied upon by Retail clients/investors.
The value of investments and the income from them can go down as well as up and investors may not get back the amount originally invested. The performance figures contained in this document relate to past performance, which should not be seen as an indication of future returns. Future returns will depend, inter alia, on market conditions, investment manager’s skill, risk level and fees. Where overseas investments are held the rate of currency exchange may cause the value of such investments to go down as well as up. Investments in emerging markets are by their nature higher risk and potentially more volatile than those inherent in some established markets. Economies in emerging markets generally are heavily dependent upon international trade and, accordingly, have been and may continue to be affected adversely by trade barriers, exchange controls, managed adjustments in relative currency values and other protectionist measures imposed or negotiated by the countries and territories with which they trade. These economies also have been and may continue to be affected adversely by economic conditions in the countries and territories in which they trade.
The contents of this document may not be reproduced or further distributed to any person or entity, whether in whole or in part, for any purpose. All non-authorised reproduction or use of this document will be the responsibility of the user and may lead to legal proceedings. The material contained in this document is for general information purposes only and does not constitute advice or a recommendation to buy or sell investments. Some of the statements contained in this document may be considered forward looking statements which provide current expectations or forecasts of future events. Such forward looking statements are not guarantees of future performance or events and involve risks and uncertainties. Actual results may differ materially from those described in such forward-looking statements as a result of various factors. We do not undertake any obligation to update the forward-looking statements contained herein, or to update the reasons why actual results could differ from those projected in the forward-looking statements. This document has no contractual value and is not by any means intended as a solicitation, nor a recommendation for the purchase or sale of any financial instrument in any jurisdiction in which such an offer is not lawful. The views and opinions expressed herein are those of HSBC Asset Management at the time of preparation and are subject to change at any time. These views may not necessarily indicate current portfolios' composition. Individual portfolios managed by HSBC Asset Management primarily reflect individual clients' objectives, risk preferences, time horizon, and market liquidity. Foreign and emerging markets: investments in foreign markets involve risks such as currency rate fluctuations, potential differences in accounting and taxation policies, as well as possible political, economic, and market risks. These risks are heightened for investments in emerging markets which are also subject to greater illiquidity and volatility than developed foreign markets. This commentary is for information purposes only. It is a marketing communication and does not constitute investment advice or a recommendation to any reader of this content to buy or sell investments nor should it be regarded as investment research. It has not been prepared in accordance with legal requirements designed to promote the independence of investment research and is not subject to any prohibition on dealing ahead of its dissemination. This document is not contractually binding nor are we required to provide this to you by any legislative provision.
All data from HSBC Asset Management unless otherwise specified. Any third-party information has been obtained from sources we believe to be reliable, but which we have not independently verified.
HSBC Asset Management is the brand name for the asset management business of HSBC Group, which includes the investment activities that may be provided through our local regulated entities. HSBC Asset Management is a group of companies in many countries and territories throughout the world that are engaged in investment advisory and fund management activities, which are ultimately owned by HSBC Holdings Plc. (HSBC Group).
- In Australia, this document is issued by HSBC Bank Australia Limited ABN 48 006 434 162, AFSL 232595, for HSBC Global Asset Management (Hong Kong) Limited ARBN 132 834 149 and HSBC Global Asset Management (UK) Limited ARBN 633 929 718. This document is for institutional investors only and is not available for distribution to retail clients (as defined under the Corporations Act). HSBC Global Asset Management (Hong Kong) Limited and HSBC Global Asset Management (UK) Limited are exempt from the requirement to hold an Australian financial services license under the Corporations Act in respect of the financial services they provide. HSBC Global Asset Management (Hong Kong) Limited is regulated by the Securities and Futures Commission of Hong Kong under the Hong Kong laws, which differ from Australian laws. HSBC Global Asset Management (UK) Limited is regulated by the Financial Conduct Authority of the United Kingdom and, for the avoidance of doubt, includes the Financial Services Authority of the United Kingdom as it was previously known before 1 April 2013, under the laws of the United Kingdom, which differ from Australian laws;
- In Bermuda, this document is issued by HSBC Global Asset Management (Bermuda) Limited, of 37 Front Street, Hamilton, Bermuda which is licensed to conduct investment business by the Bermuda Monetary Authority;
- In France, Belgium, Netherlands, Luxembourg, Portugal, Greece, Finland, Norway, Denmark and Sweden this document is issued by HSBC Global Asset Management (France), a Portfolio Management Company authorised by the French regulatory authority AMF (no. GP99026);
- In Germany, this document is issued by HSBC Global Asset Management (Deutschland) GmbH which is regulated by BaFin (German clients) respective by the Austrian Financial Market Supervision FMA (Austrian clients);
- In Hong Kong, this document is issued by HSBC Global Asset Management (Hong Kong) Limited, which is regulated by the Securities and Futures Commission. This content has not been reviewed by the Securities and Futures Commission;
- In India, this document is issued by HSBC Asset Management (India) Pvt Ltd. which is regulated by the Securities and Exchange Board of India;
- In Italy and Spain, this document is issued by HSBC Global Asset Management (France), a Portfolio Management Company authorised by the French regulatory authority AMF (no. GP99026) and through the Italian and Spanish branches of HSBC Global Asset Management (France), regulated respectively by Banca d’Italia and Commissione Nazionale per le Società e la Borsa (Consob) in Italy, and the Comisión Nacional del Mercado de Valores (CNMV) in Spain;
- In Japan, this document is issued by HSBC Asset Management (Japan) Ltd (JRN 3010001124868), regulated by the Financial Services Agengy;
- In Malta, this document is issued by HSBC Global Asset Management (Malta) Limited which is regulated and licensed to conduct Investment Services by the Malta Financial Services Authority under the Investment Services Act;
- In Mexico, this document is issued by HSBC Global Asset Management (Mexico), SA de CV, Sociedad Operadora de Fondos de Inversión, Grupo Financiero HSBC which is regulated by Comisión Nacional Bancaria y de Valores;
- In the United Arab Emirates, this document is issued by HSBC Investment Funds (Luxembourg) S.A. – Dubai Branch (Level 20, HSBC Tower, PO Box 66, Downtown Dubai, United Arab Emirates) regulated by the Capital Market Authority (CMA) in the UAE to conduct investment fund management, portfolios management, fund administration activities (CMA Category 2 license No.20200000336) and promotion activities (CMA Category 5 license No.20200000327).
- In the United Arab Emirates, this document is issued by HSBC Global Asset Management MENA, a unit within HSBC Bank Middle East Limited, U.A.E Branch, PO Box 66 Dubai, UAE, regulated by the Central Bank of the U.A.E. and the Capital Market Authority in the UAE under CMA license number 602004 for the purpose of this promotion and lead regulated by the Dubai Financial Services Authority. HSBC Bank Middle East Limited is a member of the HSBC Group and HSBC Global Asset Management MENA are marketing the relevant product only in a sub-distributing capacity on a principal-to-principal basis. HSBC Global Asset Management MENA may not be licensed under the laws of the recipient’s country of residence and therefore may not be subject to supervision of the local regulator in the recipient’s country of residence. One of more of the products and services of the manufacturer may not have been approved by or registered with the local regulator and the assets may be booked outside of the recipient’s country of residence.
- In Singapore, this document is issued by HSBC Global Asset Management (Singapore) Limited, which is regulated by the Monetary Authority of Singapore. The content in the document/video has not been reviewed by the Monetary Authority of Singapore;
- In Switzerland, this document is issued by HSBC Global Asset Management (Switzerland) AG. This document is intended for professional investor use only. For opting in and opting out according to FinSA, please refer to our website; if you wish to change your client categorization, please inform us. HSBC Global Asset Management (Switzerland) AG having its registered office at Gartenstrasse 26, PO Box, CH-8002 Zurich has a licence as an asset manager of collective investment schemes and as a representative of foreign collective investment schemes. Disputes regarding legal claims between the Client and HSBC Global Asset Management (Switzerland) AG can be settled by an ombudsman in mediation proceedings. HSBC Global Asset Management (Switzerland) AG is affiliated to the ombudsman FINOS having its registered address at Talstrasse 20, 8001 Zurich. There are general risks associated with financial instruments, please refer to the Swiss Banking Association (“SBA”) Brochure “Risks Involved in Trading in Financial Instruments”;
- In Taiwan, this document is issued by HSBC Global Asset Management (Taiwan) Limited which is regulated by the Financial Supervisory Commission R.O.C. (Taiwan);
- In Turkiye, this document is issued by HSBC Asset Management A.S. Turkiye (AMTU) which is regulated by Capital Markets Board of Turkiye. Any information here is not intended to distribute in any jurisdiction where AMTU does not have a right to. Any views here should not be perceived as investment advice, product/service offer and/or promise of income. Information given here might not be suitable for all investors and investors should be giving their own independent decisions. The investment information, comments and advice given herein are not part of investment advice activity. Investment advice services are provided by authorized institutions to persons and entities privately by considering their risk and return preferences, whereas the comments and advice included herein are of a general nature. Therefore, they may not fit your financial situation and risk and return preferences. For this reason, making an investment decision only by relying on the information given herein may not give rise to results that fit your expectations.
- In the UK, this document is issued by HSBC Global Asset Management (UK) Limited, which is authorised and regulated by the Financial Conduct Authority;
- In the US, this document is issued by HSBC Securities (USA) Inc., an HSBC broker dealer registered in the US with the Securities and Exchange Commission under the Securities Exchange Act of 1934. HSBC Securities (USA) Inc. is also a member of NYSE/FINRA/SIPC. HSBC Securities (USA) Inc. is not authorized by or registered with any other non-US regulatory authority. The contents of this document are confidential and may not be reproduced or further distributed to any person or entity, whether in whole or in part, for any purpose without prior written permission.
- In Chile, operations by HSBC's headquarters or other offices of this bank located abroad are not subject to Chilean inspections or regulations and are not covered by warranty of the Chilean state. Obtain information about the state guarantee to deposits at your bank or on www.cmfchile.cl;
- In Colombia, HSBC Bank USA NA has an authorized representative by the Superintendencia Financiera de Colombia (SFC) whereby its activities conform to the General Legal Financial System. SFC has not reviewed the information provided to the investor. This document is for the exclusive use of institutional investors in Colombia and is not for public distribution;
- In Costa Rica, the Fund and any other products or services referenced in this document are not registered with the Superintendencia General de Valores (“SUGEVAL”) and no regulator or government authority has reviewed this document, or the merits of the products and services referenced herein. This document is directed at and intended for institutional investors only.
- In Peru, HSBC Bank USA NA has an authorized representative by the Superintendencia de Banca y Seguros in Perú whereby its activities conform to the General Legal Financial System - Law No. 26702. Funds have not been registered before the Superintendencia del Mercado de Valores (SMV) and are being placed by means of a private offer. SMV has not reviewed the information provided to the investor. This document is for the exclusive use of institutional investors in Perú and is not for public distribution;
- In Uruguay, operations by HSBC's headquarters or other offices of this bank located abroad are not subject to Uruguayan inspections or regulations and are not covered by warranty of the Uruguayan state. Further information may be obtained about the state guarantee to deposits at your bank or on www.bcu.gub.uy.
Copyright © HSBC Global Asset Management Limited 2026. All rights reserved. No part of this publication may be reproduced, stored in a retrieval system, or transmitted, on any form or by any means, electronic, mechanical, photocopying, recording, or otherwise, without the prior written permission of HSBC Asset Management.
Content ID: D076184; Expiry date: 31.07.2027.